Measurement system analysis
Report Analyzer
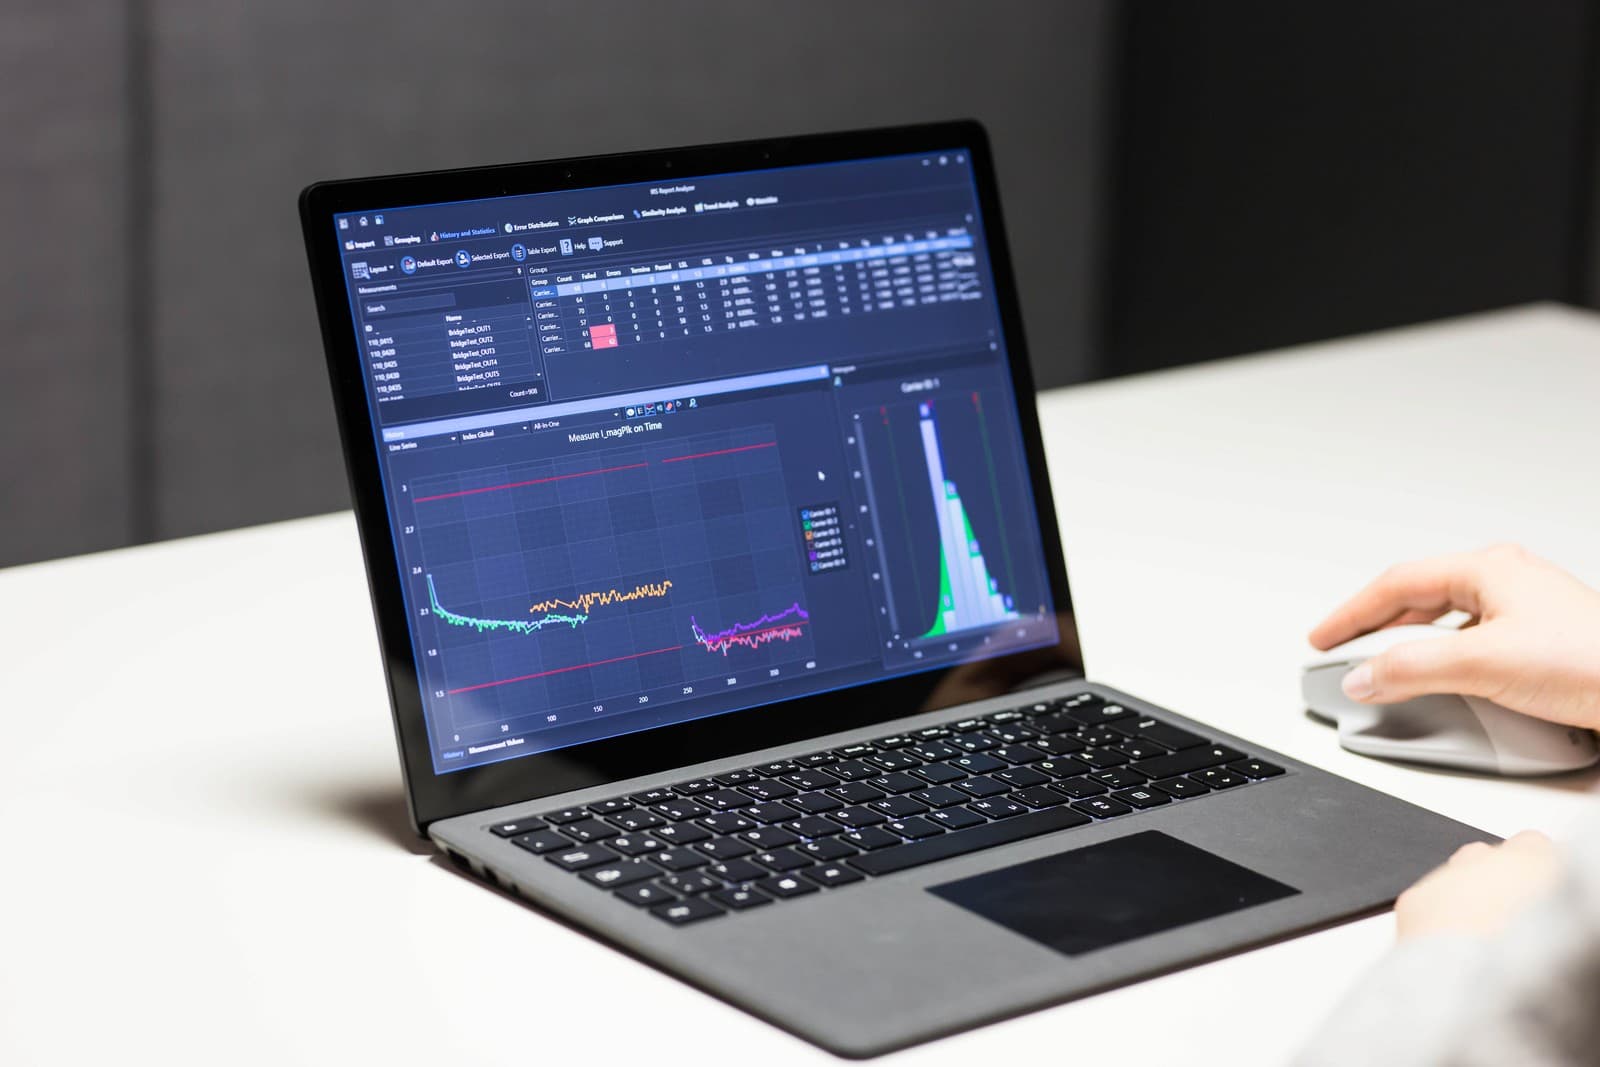
Measurement system analysis with Report Analyzer
When manufacturing and developing measurement systems, it must be ensured that the respective measurement/test process is suitable for its intended use. Such a measurement process depends on many influencing factors, including the operating personnel, the environment, the evaluation method, the measured object and the fixture. To determine whether a measurement/test process is capable under these influencing factors, a measurement system analysis (MSA) can be carried out with the Report Analyzer. In this context, systematic measurement deviation or variation of the measuring device is assessed. The software can import data from various sources and then evaluate it. The data can be grouped, displayed and analyzed according to user-specific criteria. Processing the data in this way makes it possible to draw conclusions, e.g. about the causes of failures or possible trends in the measured values. The evaluation or analysis is divided into several sub-analyses. These include
the statistical evaluation of the measurement data with regard to measurement system capability and test process suitability,
- the statistical error distribution,
- the correlation analysis (similarity analysis) of measurements,
- the curve comparison of measurements
- and the trend analysis of measured value curves.

- Modules
Import
Import of test reports or test executions in the IRS XML format. In addition, other formats from different sources, such as databases, can be imported. Thanks to a plugin structure, customer-specific formats or sources can also be processed.
Grouping
To allow analysis data to be compared based on certain characteristics, the test executions are divided into groups. Defined groupings, sort orders and filters can be saved as predefined sets and reapplied via a quick selection. Grouping makes it possible to compare results with each other, for example the temperature classes in climate tests or the measured value curves in long-term tests. Measurements on different test stands can also be evaluated separately, which is particularly helpful for uncovering possible errors when developing measurement and test systems.
History & statistics
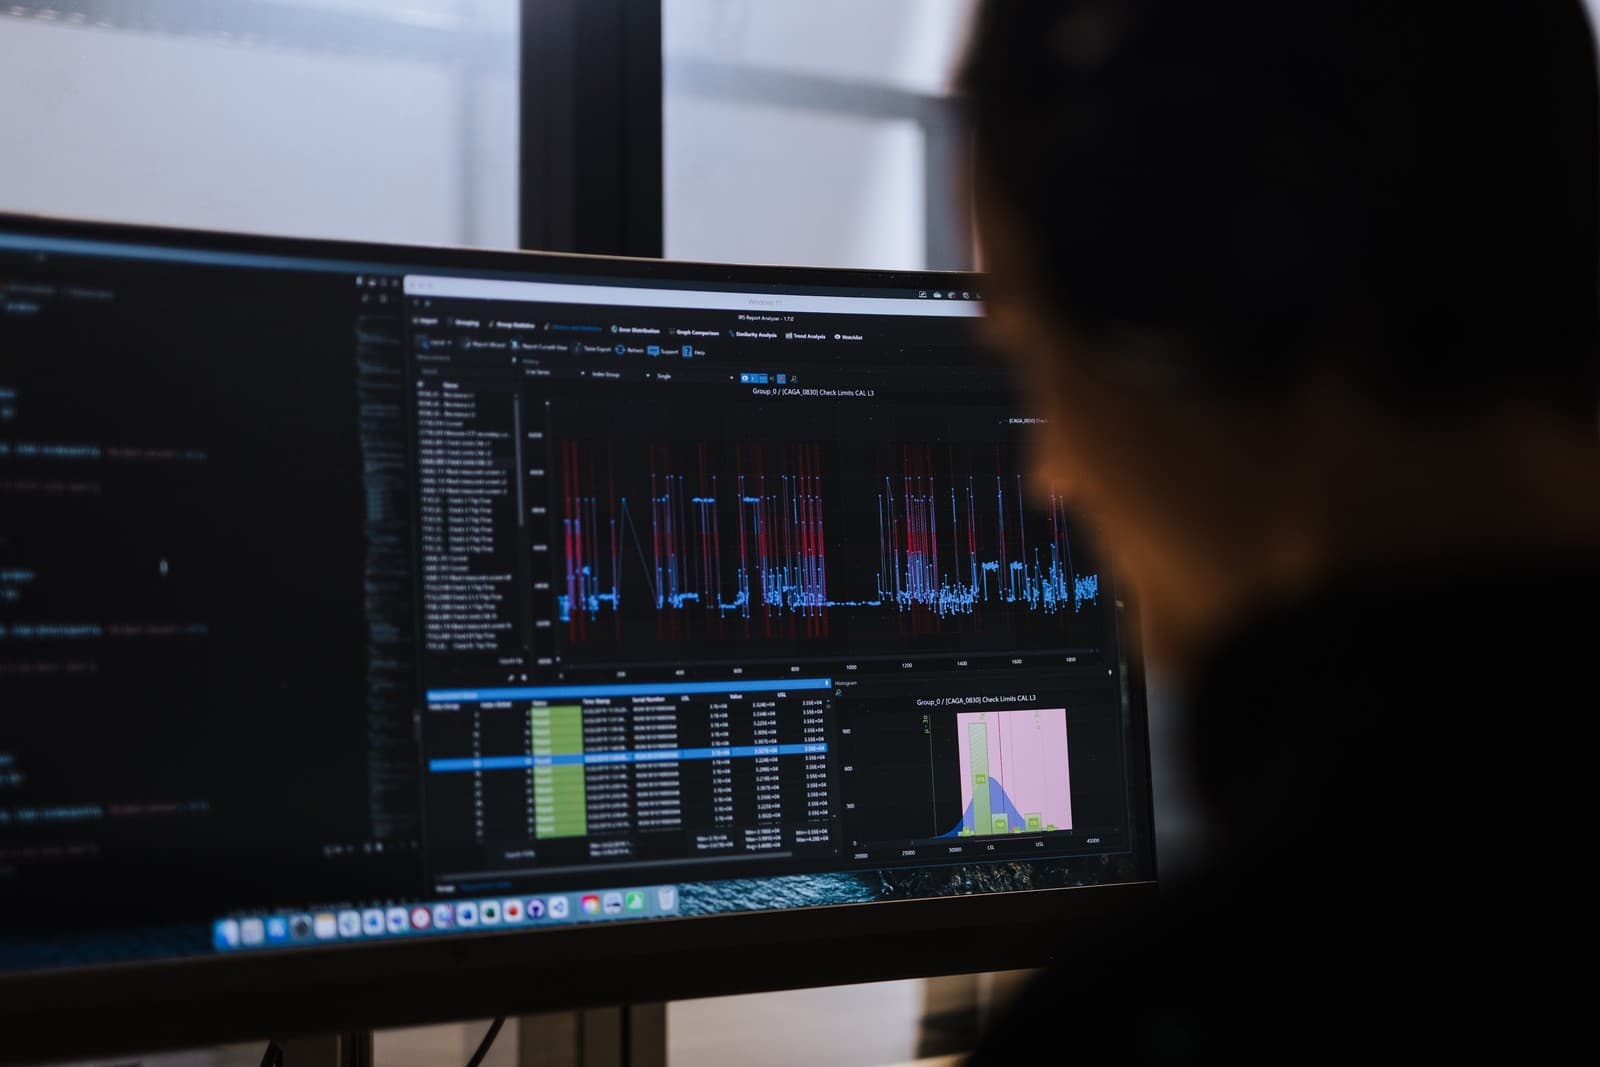
This type of analysis performs and visualizes statistical value analyses. Moving limits can be displayed and limit violations highlighted. In addition, statistical values are determined, such as mean, standard deviation, specification limits, measurement system capability indices and process capability indices. Various chart types are available for visualization, e.g. scatter or line charts with variable axes (time, index, serial number, etc.). A distribution curve with an overlaid histogram and the relevant key figures can also be displayed.
Statistical error distribution
In this sub-analysis, the statistical error distribution is determined and visualized on two levels. The first level is the test execution level, which evaluates the results of the test executions of a group. The error distribution on the first level allows conclusions to be drawn about how the results are distributed across groups. The second level is the test step level. Here, the results of the test steps of a group of test executions are evaluated and compared with those of the other groups.
Curve comparison
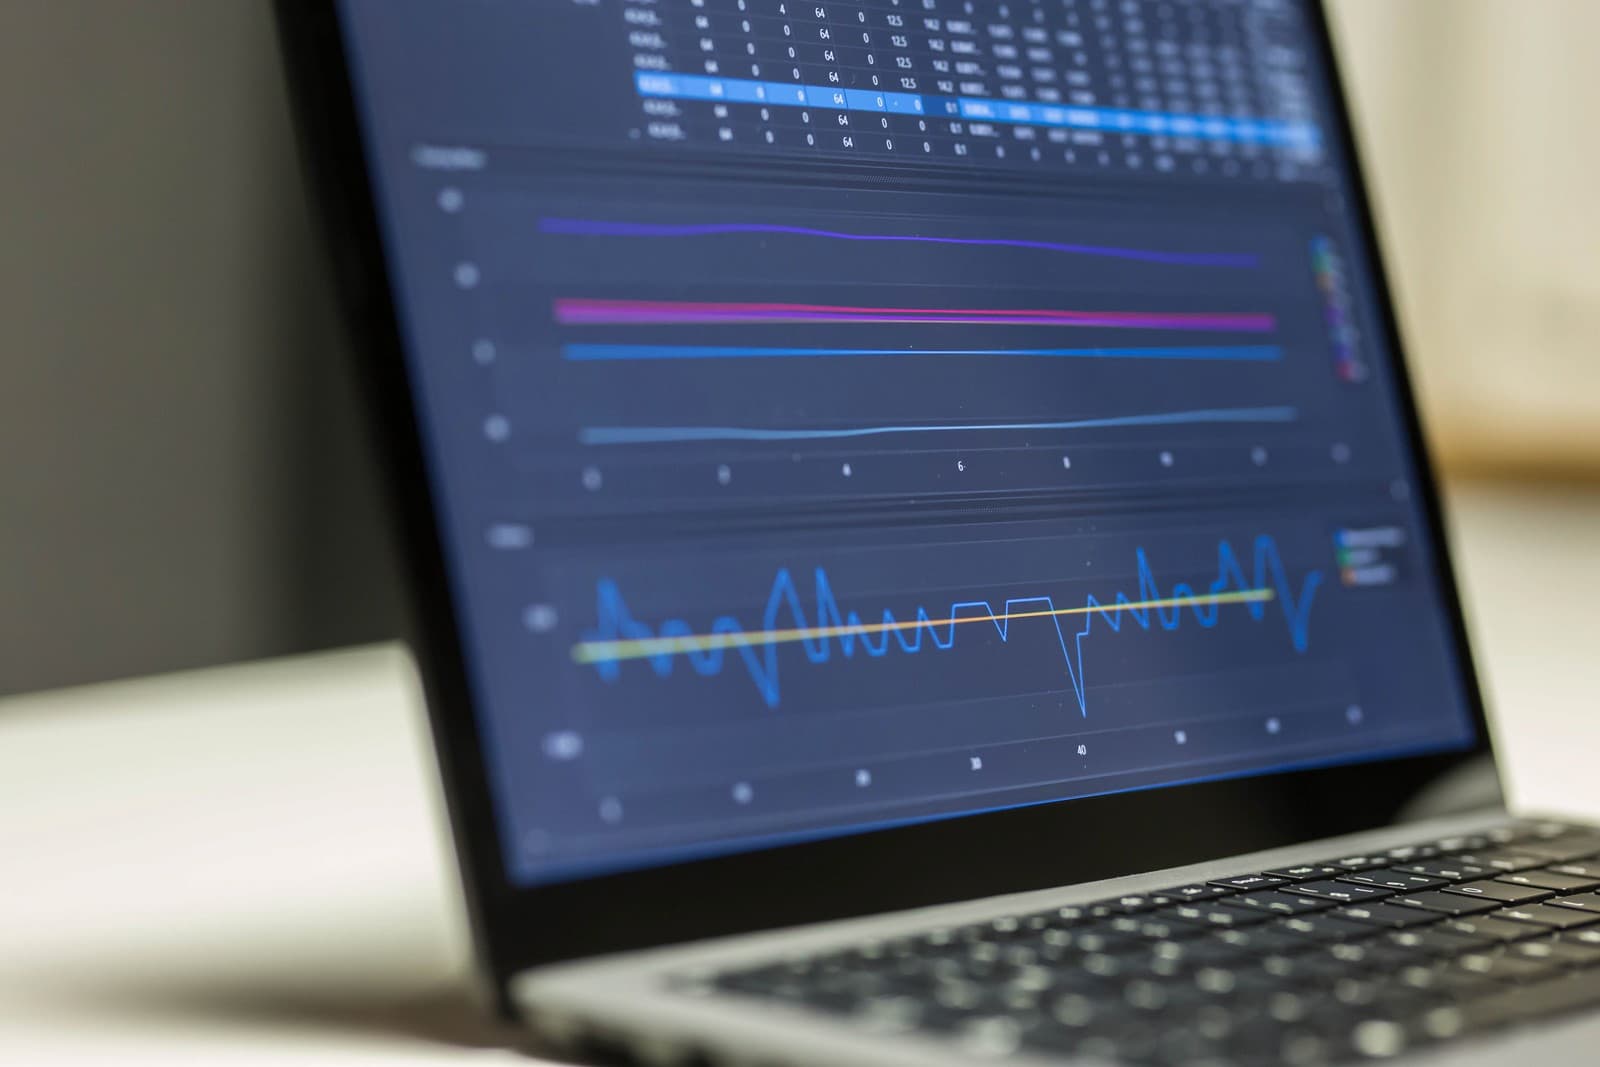
The primary goal of the curve comparison function is to reveal relationships between different measurements. The “measurement over measurement” view allows conclusions to be drawn about how the two measurements depend on each other. Another view is the value curve, which focuses on comparing several measurements of a group by displaying them together in one chart.
Similarity analysis
The similarity analysis determines linear relationships between measurements. Correlation analysis can thus be used to determine whether one test step is strongly related to another.
Trend analysis
The trend analysis aims to identify trends in the variation or the mean of a measurement series. Since the data to be analyzed consists of very large data sets, the trends have to be detected, prioritized and assessed automatically.
Let's work together
Are you facing a demanding measurement or testing task? We design, develop and build the right solution together with you.